ECONOMY: ECONOMIC DATA IMPROVES IN SEPTEMBER
Economic data improved modestly in September as the U.S. economy stayed resilient against trade uncertainty.
The Conference Board’s Leading Economic Index (LEI) was unchanged month over month in August after a strong July gain. The LEI rose 1.1% year over year, signaling future economic growth.
The August jobs report, released in early September, showed nonfarm payrolls growth was below consensus expectations. Even though jobs growth slowed, the 12-month average pace of payroll gains was slightly above the expansion average, evidence that companies are still hiring at a solid pace [Figure 1].
The pace of consumer inflation picked up. The core Consumer Price Index (CPI), which excludes food and energy prices, rose 2.2% year over year in August, one of its highest readings of the cycle.

Core personal consumption expenditures (PCE), the Federal Reserve’s (Fed) preferred inflation gauge, rose 1.8% year over year in August, below policymakers’ 2% target.
Wholesale price growth has waned in recent months, which could point to weaker inflationary pressures ahead. The core Producer Price Index (PPI), which excludes food and energy prices, grew 2% year over year, the slowest pace in 16 months.
Average hourly earnings rose 3.2% year over year in August. Wage growth has moderated in recent months, but it has remained at a level that should continue to support consumer spending without concerns of overheating.
U.S. manufacturing deteriorated further, caving to a global trend of weakness in the sector. The Institute for Supply Management’s (ISM) manufacturing Purchasing Managers Index (PMI), a gauge of U.S. manufacturing health, fell to 49.1, its first time in contractionary territory (below 50) since August 2016. Preliminary Markit PMI data contradicted the ISM data, showing that the manufacturing sector remained in expansionary territory (above 50).
Data on the U.S. consumer was mixed. The Conference Board’s Consumer Confidence Index posted its second biggest drop since 2011 in September. However, retail sales climbed for a sixth straight month in August, evidence that declining consumer sentiment hasn’t materially weighed on spending yet.
Business spending continued to flounder amid trade uncertainty. Orders for nondefense capital goods (excluding aircraft) fell 1.8% year over year in August, the biggest decline since October 2016.
Central Banks Reconvene
Central banks around the world reconvened in September after a summer break.
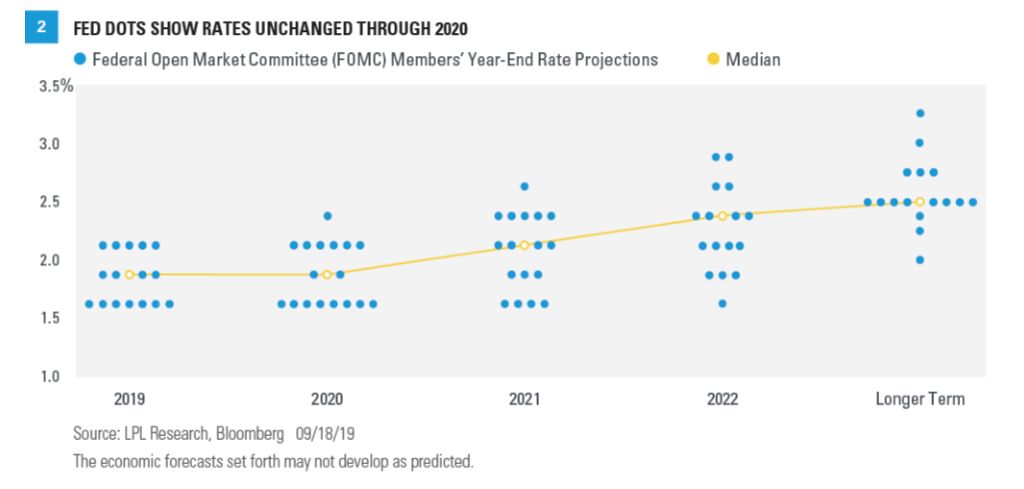
The Fed policy committee cut its policy rate by 25 basis points (.25%) to a target range of 1.75–2% in September. Policymakers’ updated “dot plot,” or summary of rate projections, now shows that rates could stay at these levels through the end of 2020, according to the median forecast [Figure 2]

On September 12, the European Central Bank (ECB) cut its target interest rate by 0.1% and further into negative territory to -0.5% and committed to purchasing 20 billion euros ($22 billion) of Eurozone debt each month until inflation achieves the central bank’s target of just under 2% growth.
The Bank of Japan decided against additional policy stimulus at its September meeting, but it did indicate it will review its assessment of its economy and inflation next month, sparking speculation that more easing measures may be forthcoming.
Click here to download a PDF of this report.
IMPORTANT DISCLOSURES
Investing involves risks including possible loss of principal. No investment strategy or risk
management technique can guarantee return or eliminate risk in all market environments.
The opinions voiced in this material are for general information only and are not intended to provide specific advice or recommendations for any individual security. To determine which investment(s) may be appropriate for you, consult your financial advisor prior to investing. The economic forecasts set forth in this material may not develop as predicted. All performance referenced is historical and is no guarantee of future results.
All information is believed to be from reliable sources; however LPL Financial makes no representation as to its completeness or accuracy.
For a list of descriptions of the indexes referenced in this publication, please visit our website at lplresearch.com/definitions.
This Research material was prepared by LPL Financial, LLC.
Securities and advisory services offered through LPL Financial (LPL), a registered investment advisor and broker-dealer (member FINRA/SIPC). Insurance products are offered through LPL or its licensed affiliates. To the extent you are receiving investment advice from a separately registered independent investment advisor, please note that LPL is not an affiliate of and makes no representation with respect to such entity.
If your advisor is located at a bank or credit union, please note that the bank/credit union is not registered as a broker-dealer or investment advisor. Registered representatives of LPL may also be employees of the bank/credit union. These products and services are being offered through LPL or its affiliates, which are separate entities from, and not affiliates of, the bank/credit union. Securities and insurance offered through LPL or its affiliates are:
Not FDIC or NCUA/NCUSIF Insured | No Bank or Credit Union Guarantee | May Lose Value | Not Guaranteed by Any Government Agency | Not a Bank/Credit Union Deposit
Tracking #1-902862 (Exp. 10/20)
